|
Getting your Trinity Audio player ready...
|
Electoral democracy – a democratic government based on a system that enables all citizens to select one candidate from a list of competitors for political office in a process of election. Each citizen becomes a voter who casts a secret ballot indicating their choices. In order for the election to qualify for democratic integrity, the process must be free and fair without any coercion or bribery tactics and independent of the incumbents.
The South African public still largely recognises that there is a duty to vote in elections, despite various pressures on democracy that go beyond the borders of this country.
This was shared on 21 September by Dr Benjamin Roberts, at a seminar hosted by the Independent Electoral Commission (IEC) under the theme of Safeguarding Electoral Democracy in the Age of Growing Mistrust. Roberts is the acting strategic lead and research director in the developmental capable and ethical state research division of the Human Sciences Research Council (HSRC), which has worked with the IEC for some 20 years to track public perceptions and trends regarding electoral democracy and voting.
The HSRC was recently commissioned by the IEC to undertake an analysis of the long-term trends in all the election-related surveys conducted to date, and to present these findings at the seminar.
“There has been growing debate about both the quality as well as the performance of democracy across countries,” said Roberts, introducing his presentation. “There’s also been evidence of mounting public discontent and its particular bearing on different aspects. of political legitimacy, as well as political behaviour.”
These situations, he said, are leading to reflections on the degree to which changing norms are observed, particularly in relation to electoral participation.
Global democratic recession
In the 1990s and early 2000s, Roberts added, there was a fair amount of optimism about the future of democracy. “But since the mid-2000s, there has been evidence of a period of what was termed global democratic recession.”
Research by non-profit organisation Freedom House has shown a consecutive year on year decline, over the past 16 years, in the numbers of countries that have remained democratic versus those that have shown some elements of reversal. However, in the last six years or so, there is increasing evidence of some deterioration in both democratic norms and institutions, coupled with the rise of authoritarian tendencies in certain parts of the world.
Analysts are concerned about whether these are the signs of a move from a democratic recession as part of the general ebb and flow of democracy, towards a gathering crisis of liberal democracy as a whole.
This is where the HSRC’s research comes in, as it covers a range of election-related aspects, looking at trends over time among the voting-age public. “It serves as a good summary digest to really reflect on what needs to be taken into account as we move towards successive elections, from an electoral management and operations stance, but also in terms of democracy as a whole.”
The research presented at the event, he said, covers the combined outcomes of the HSRC’s voter participation surveys and election satisfaction surveys.
Demand for and satisfaction with democracy
In 2021, the majority (44%) of respondents agreed that democracy is preferable to any kind of government – though that percentage has dipped substantially from its 2015 high of 61%.
This is a source of concern, said Roberts, “What we’ve seen rise, in terms of other options open to the voting-age public, was this more fatalistic view … it represents people saying ‘for someone like me, it doesn’t matter what kind of government we have’.”
With 27% of respondents taking that position, said Roberts, it is becoming a situation to be guarded against. “You don’t want to see this fatalism increasingly pervading the views of the voting age public and seeing a diminished demand for democracy as a whole.”
Another statistic of concern is the view of 23% who say that in some circumstances, non-democratic governments can be preferable.
This could be linked to the growing number of people who are dissatisfied with the way democracy is working in South Africa, he said. The numbers have shifted dramatically over time – back in 2003, 48% were satisfied with democracy and 38% were not satisfied. The numbers overlapped for the first time in 2008 and now, some 19 years after the first poll, 56% are dissatisfied while only 23% are satisfied with the way democracy is working for them in South Africa.
“Since 2011 onwards, we’ve seen a phenomenon where the share that has been dissatisfied with democracy has consistently outweighed the share that is satisfied … this is important in terms of capturing the political mood of our society.”
Asked if South Africa is going in the right direction, in 2021 an alarming 78% said it was not, while just 17% said it was. Again, this is a marked difference from the almost equal percentages of 46% and 45% respectively, captured in 2010. This reinforces the general public perception, said Roberts, that democracy is not really living up to the promise of what the public would like it to deliver.
Is government doing its work properly?
Respondents were polled on their satisfaction with various aspects of government performance – the provision of social grants, electricity, water and sanitation, and job creation. The first three aspects showed a distinct overall downward trend between 2003 and 2021, while satisfaction with job creation, which was never above 20%, hovered in 2021 around the 10% mark.
Unsurprisingly, satisfaction with electricity supply showed the biggest overall drop of the four, especially since 2015, where it fell from just over 70% satisfied to 40% satisfied in 2021.
“Other areas also harshly evaluated are our government’s anti-corruption efforts and crime reduction efforts.”
In terms of patterns of trust in institutions, all three spheres of government – national, provincial and local – declined steadily from 2003 to the present. This is seen most particularly in national government and Parliament, said Roberts.
“Post 2010 we’ve seen sharp declines, so that trust in those two core elements of government now hovers around the 30% mark.”
Trust in local government, which has typically been more harshly evaluated as the coalface of service delivery, saw a dip from around 40% in 2003 to just 24% in 2021.
Trust in political parties, meanwhile, currently stood at a paltry 19%, from its starting mark of just over 40% in 2005.
Electoral attitudes
General interest in government elections is on the wane, Roberts says. Not too long ago in 2005, 76% of respondents said they were interested in voting. This rose to a high of 80% in 2008, but by 2021 it had dropped to 59%.
“This is … the extent to which the public recognises that they as a citizen, they have a duty to vote. So we actually pose a simple statement – it’s the duty of all citizens to vote. This typically has been, I think, the good news story in that it’s been a very, very deeply rooted belief amongst South Africans. It’s hovered around the 75 to 80% mark for many of the years examined.”
However, the general sense of the duty to vote dropped to an all-time low to 62% in 2021 – meaning that the 2021 local government elections occurred in the context of the lowest ‘sense of duty to vote’ percentage seen in the last two decades. If this continues, said Roberts, it will affect future voter turnout.
“What’s interesting here is that a lot of our younger South Africans still carry that sense of duty … I think one of the factors that has prevented a big normative shift away from the ballot box is that youngsters, for the most part, still show a fairly robust sense of the duty to vote.”
But again, Roberts cautioned, this was starting to shift, so for those who are first-time eligible voters or those who have yet to register to vote, it is important to get them to the ballot box for their first formative electoral experience.
In terms of age group, 69% of the 55+ population said it is their duty to vote – this is the highest figure of all results in this category – compared to 55% of 18 to 24-year-olds, 38% of 24 to 34-year-olds, and 64% of 35 to 54-year-olds.
“We worry that 27% of 18 to 24-year-olds firmly disagree with this view. This is not ambivalence – quite a few youngsters are saying ‘no, I no longer have that duty’. So it’s one that we need to watch out for.”
Other voter challenges
In terms of barriers to voter registration, political disinterest was the highest reason across the board, at 65% in 2021 – and it has far out-performed any other factors since 2005. Administrative barriers was second though still far behind at 6% in 2021, followed by ‘not got around to it’ at 6%, political intimidation at 2%, and religious reasons at 2%.
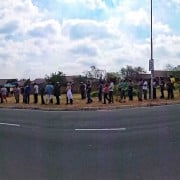
Other voter experiences, such as the queuing time at the voting station, the ease of understanding the procedure once inside, the conduct of electoral officials, and confidence in the secrecy of their vote, were generally positive.
Roberts noted with concern, however, that levels of political coercion had increased over the years, with more than 10% of respondents saying they had experienced it, compared to around 4% in 2009.
In 2021 most (8%) said they had experienced it before getting to the voter station, while 3% said they were intimidated while waiting to vote. Respondents said the intimidation came mainly from social networks, particularly families and friends who attempted to sway their vote.
